This graph compares a typical daily pattern of changing atmospheric pressure (blue) with the pattern during a regional dust storm hundreds of miles away (red).
+
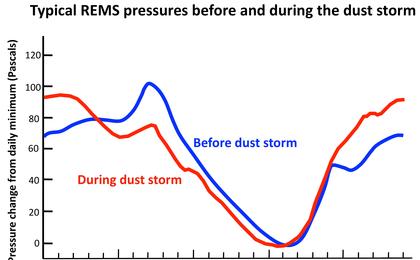
Image Credit: NASA/JPL-Caltech