All Mars Resources
Filters
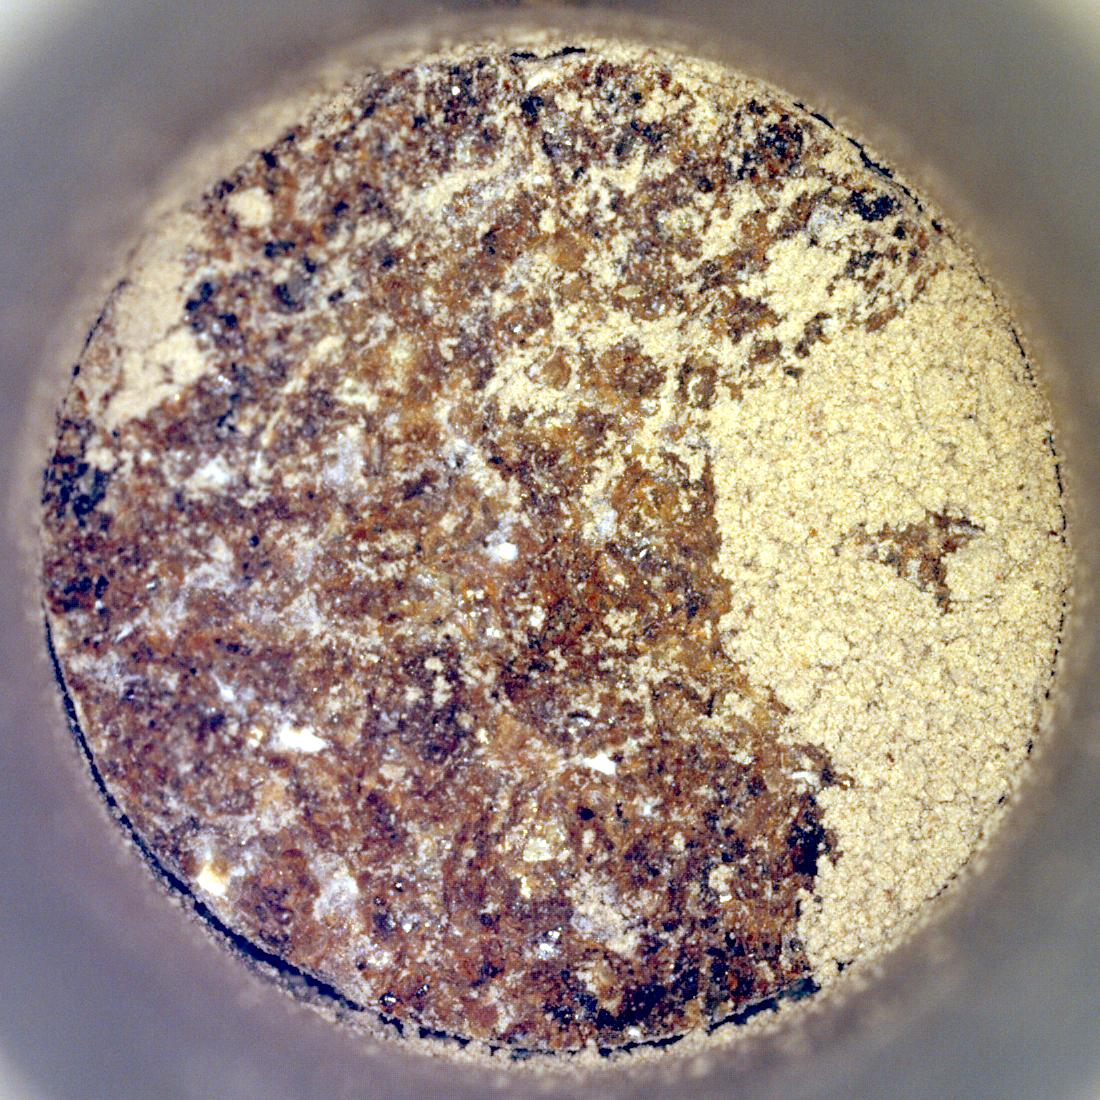
Perseverance’s ‘Bunsen Peak’ Sample
NASA’s Perseverance Mars rover captured this image of a sample cored from a rock called “Bunsen Peak” on March 11,…
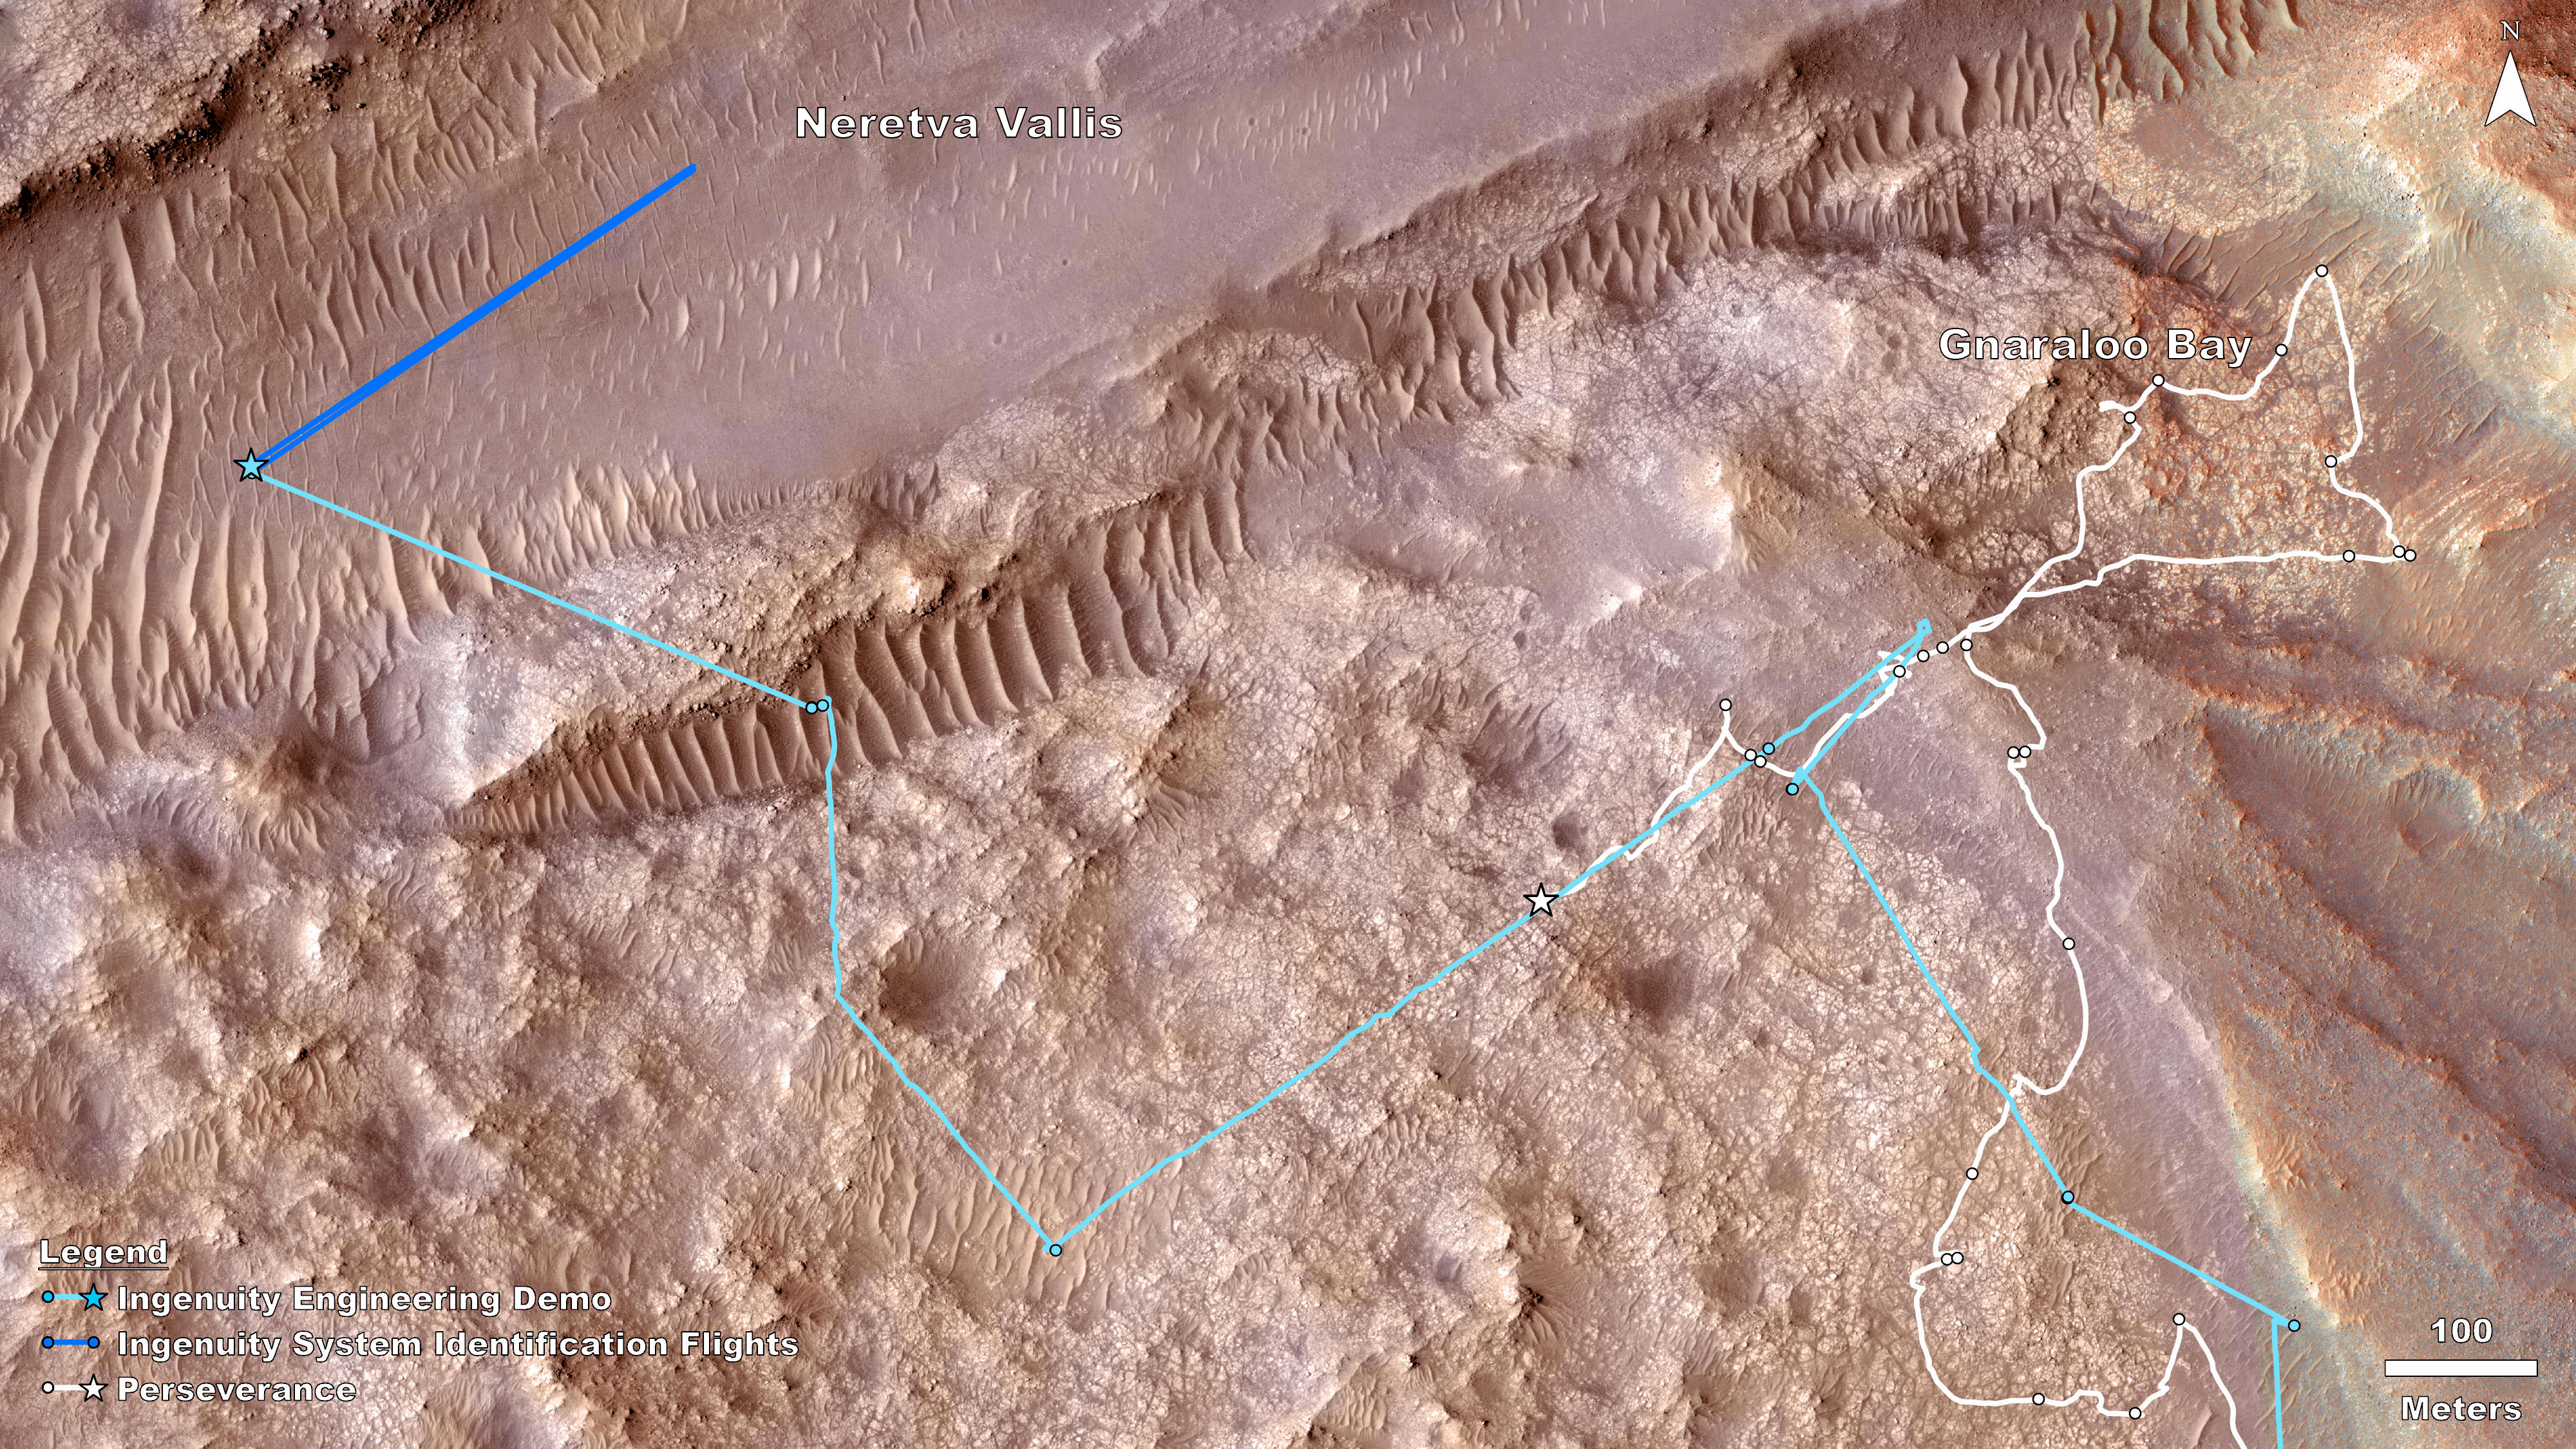
Rover, Helicopter Locations in Jezero Crater
This map shows the locations of NASA’ Perseverance rover (white star) and Ingenuity Mars Helicopter (cyan star) on Dec. 19,…
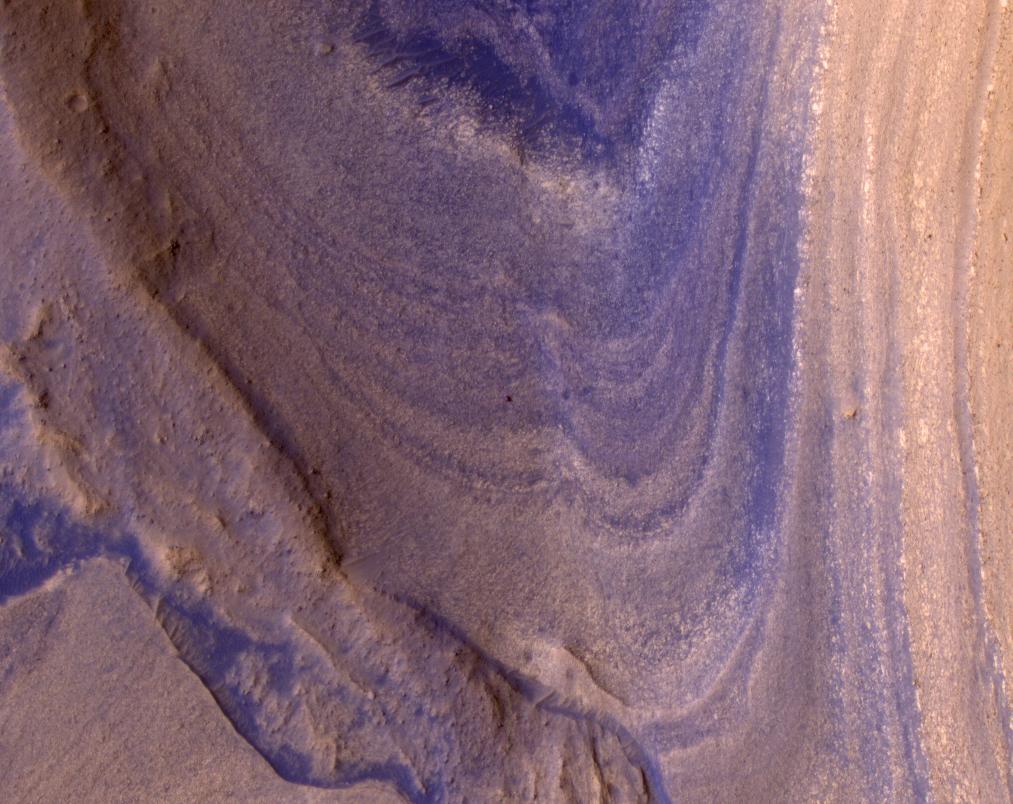
HiRISE Spots Curiosity Driving Toward Upper Gediz Vallis
NASAs Curiosity Mars rover appears as a dark speck in this image captured from directly overhead by the agencys Mars…
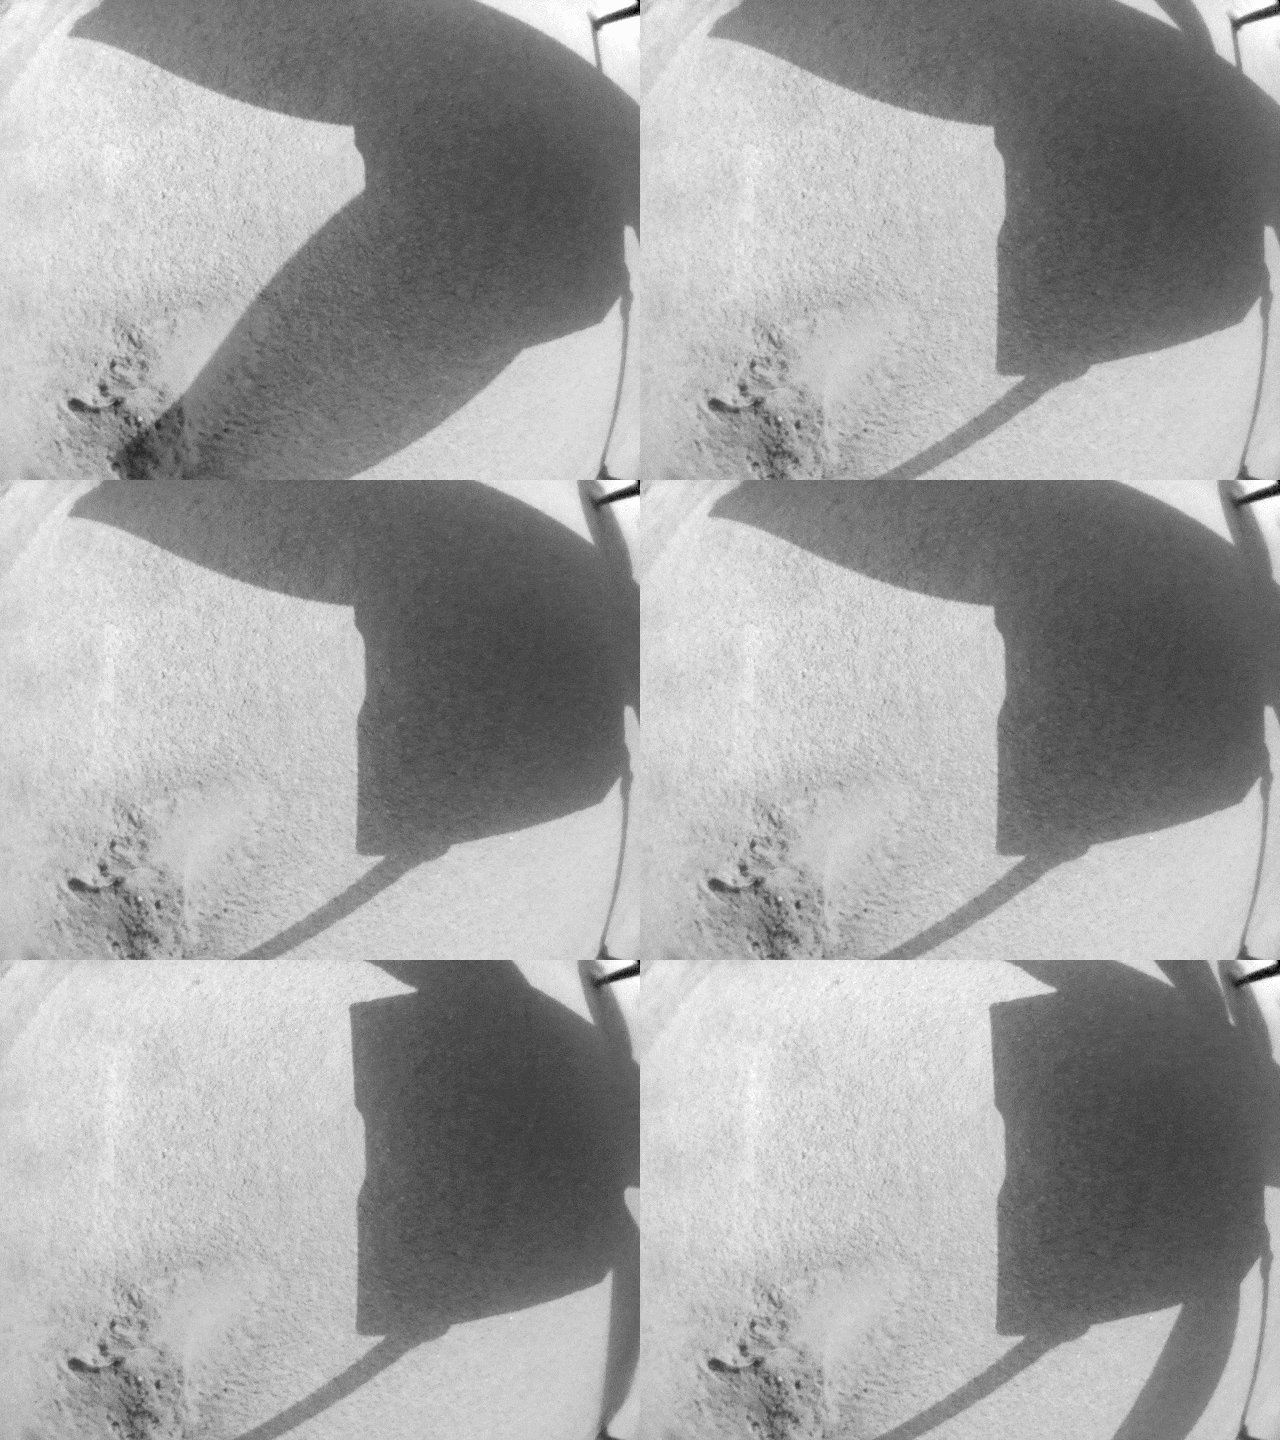
Ingenuity’s Navcam Reveals a Missing Rotor Blade
NASA’s Ingenuity Mars Helicopter used its black-and-white navigation camera to capture this video showing the shadows of its rotor blades…

SuperCam’s RMI Spots Ingenuity’s Broken Rotor
The Remote Microscopic Imager (RMI) camera aboard NASA’s Perseverance Mars rover took these zoomed-in images of the Ingenuity Mars Helicopter…

Ingenuity at ‘Valinor Hills’
This natural-color mosaic showing NASA’s Ingenuity Mars Helicopter at “Valinor Hills” was acquired by the agency’s Perseverance Mars rover on…
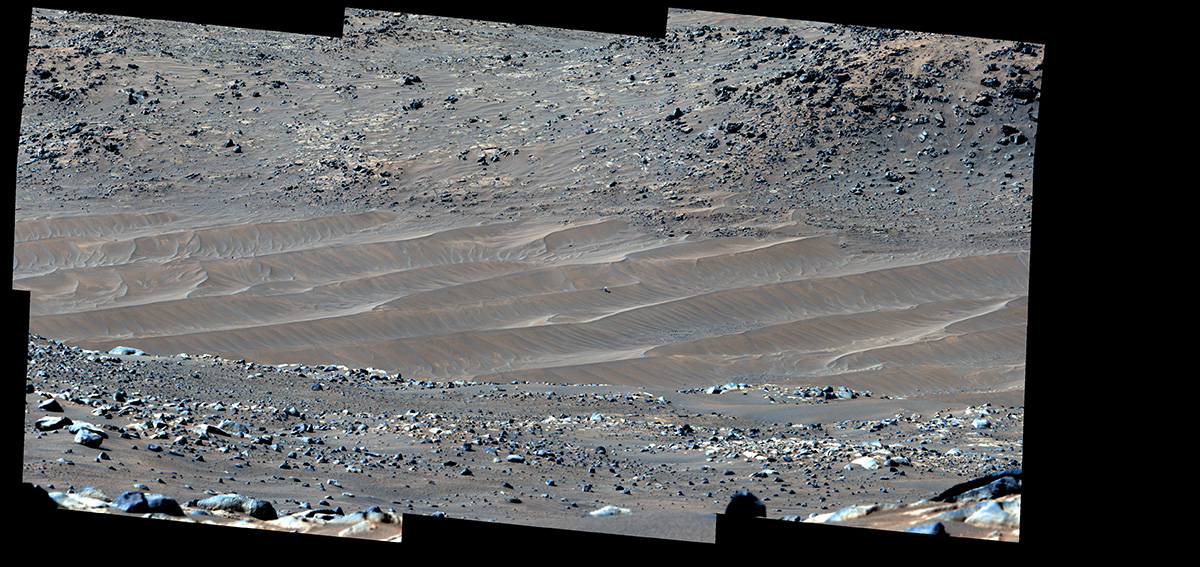
Perseverance Spots Ingenuity at Its Final Airfield
NASA’s Perseverance Mars rover captured this mosaic showing the Ingenuity Mars Helicopter at its final airfield on Feb. 4, 2024.…
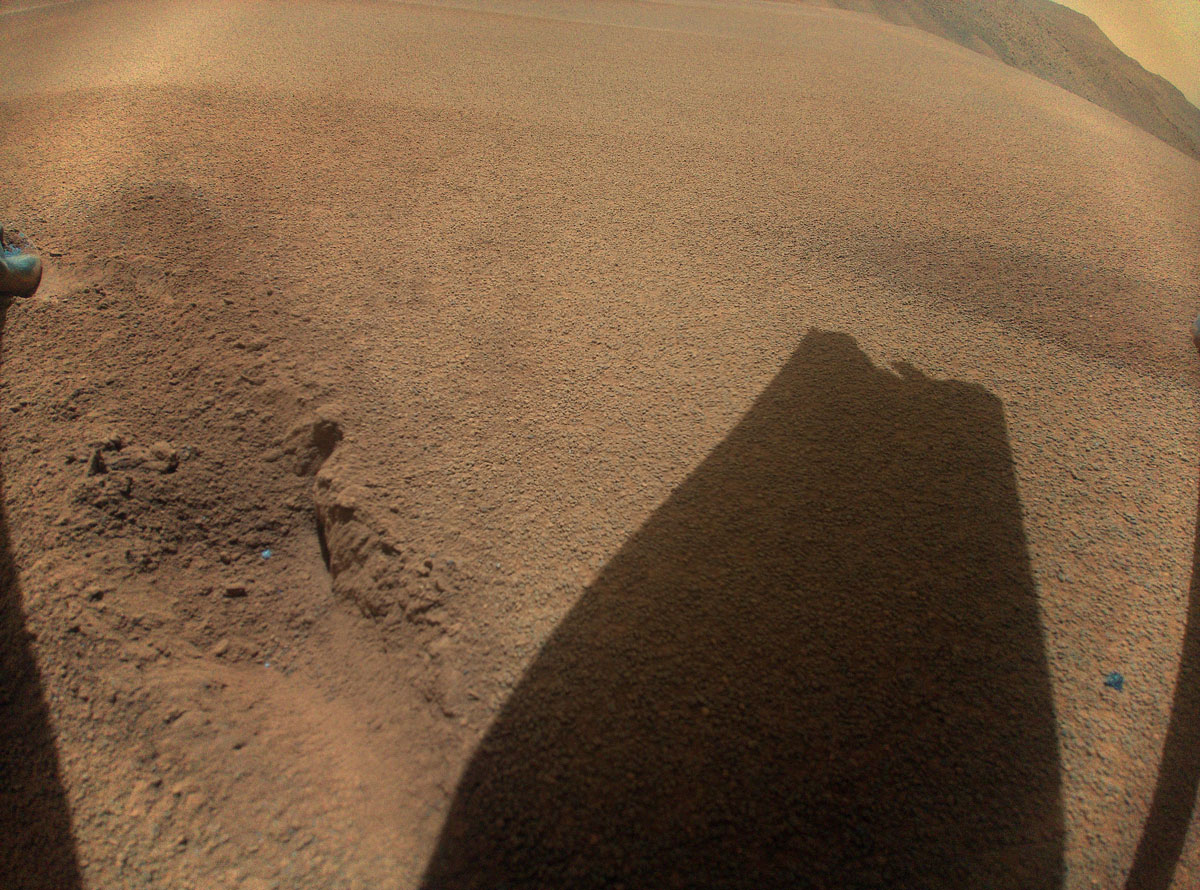
Ingenuity Spots the Shadow of its Damaged Rotor Blade
After its 72nd flight on Jan. 18, 2024, NASA’s Ingenuity Mars Helicopter captured this color image showing the shadow of…
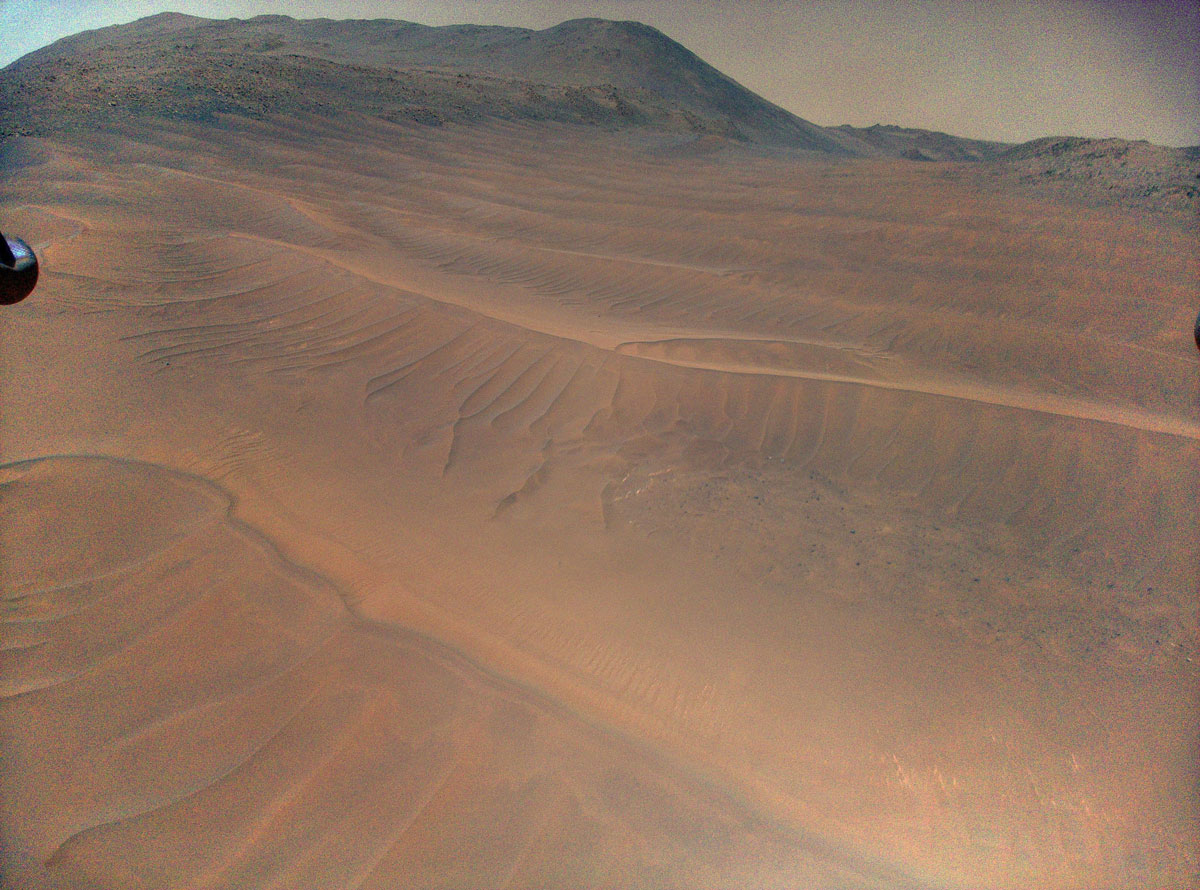
Ingenuitys View of Sand Dunes During Flight 70
NASA’s Ingenuity Mars Helicopter captured this view of sand ripples during its 70th flight, on Dec. 22, 2023. The smooth,…
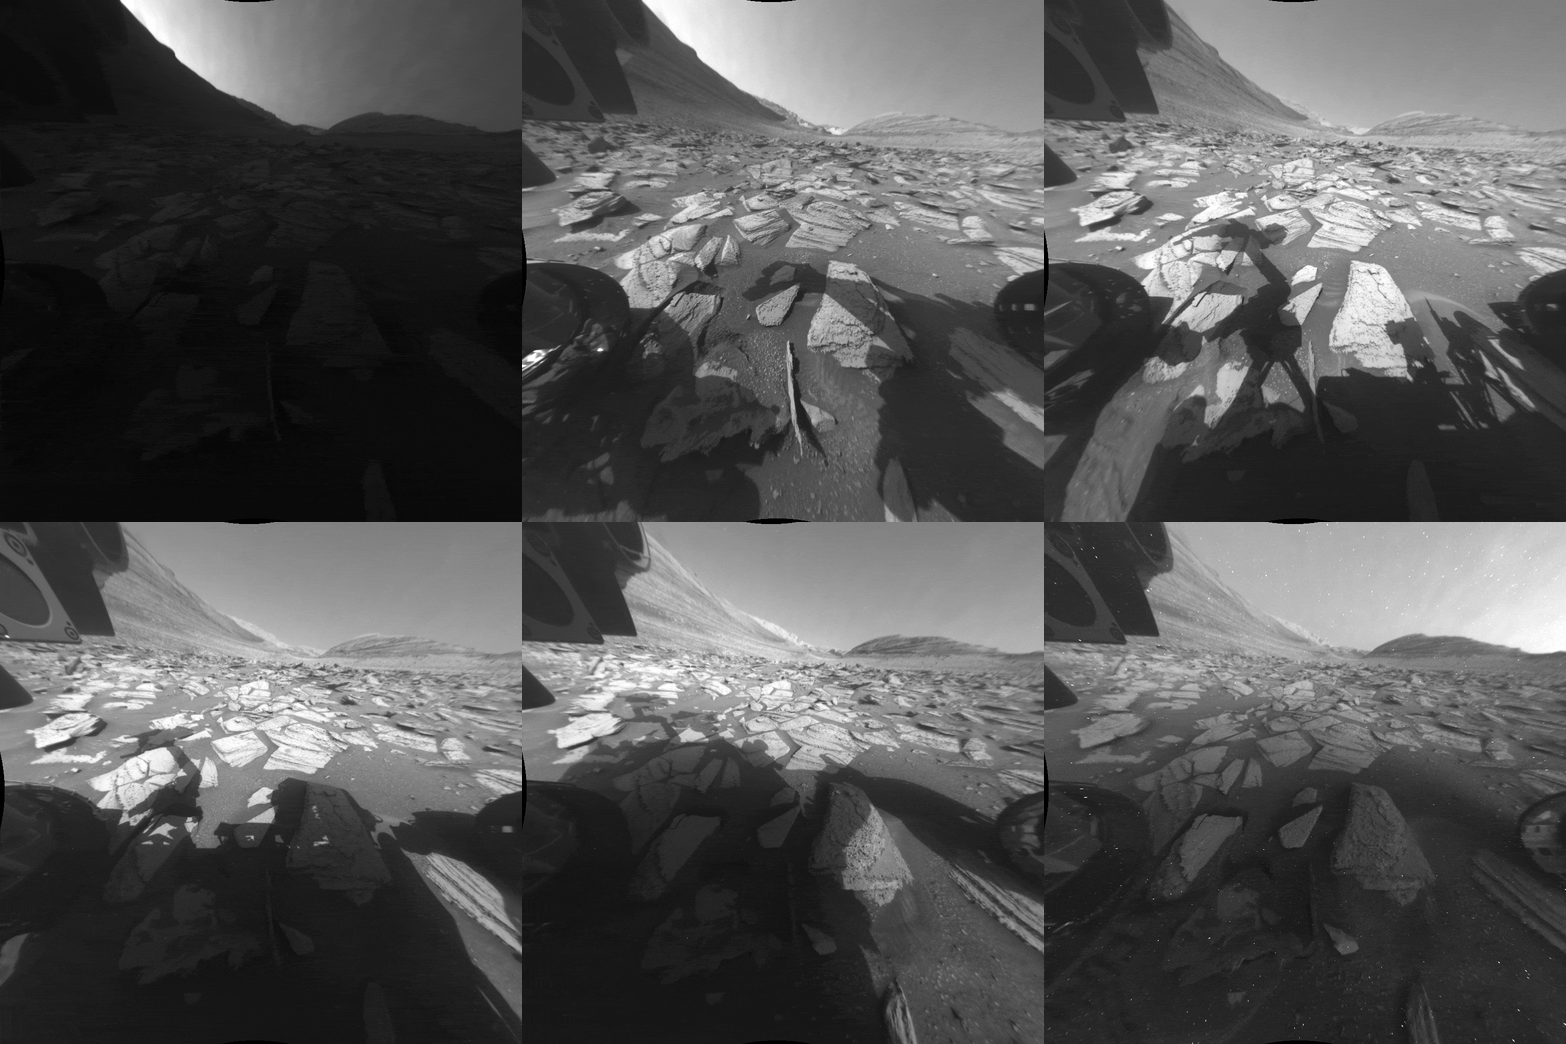
Curiosity’s Hazcams Capture a Day on Mars During Conjunction
While stationary for two weeks during Mars solar conjunction in November 2023, NASA’s Curiosity rover used its front and rear…
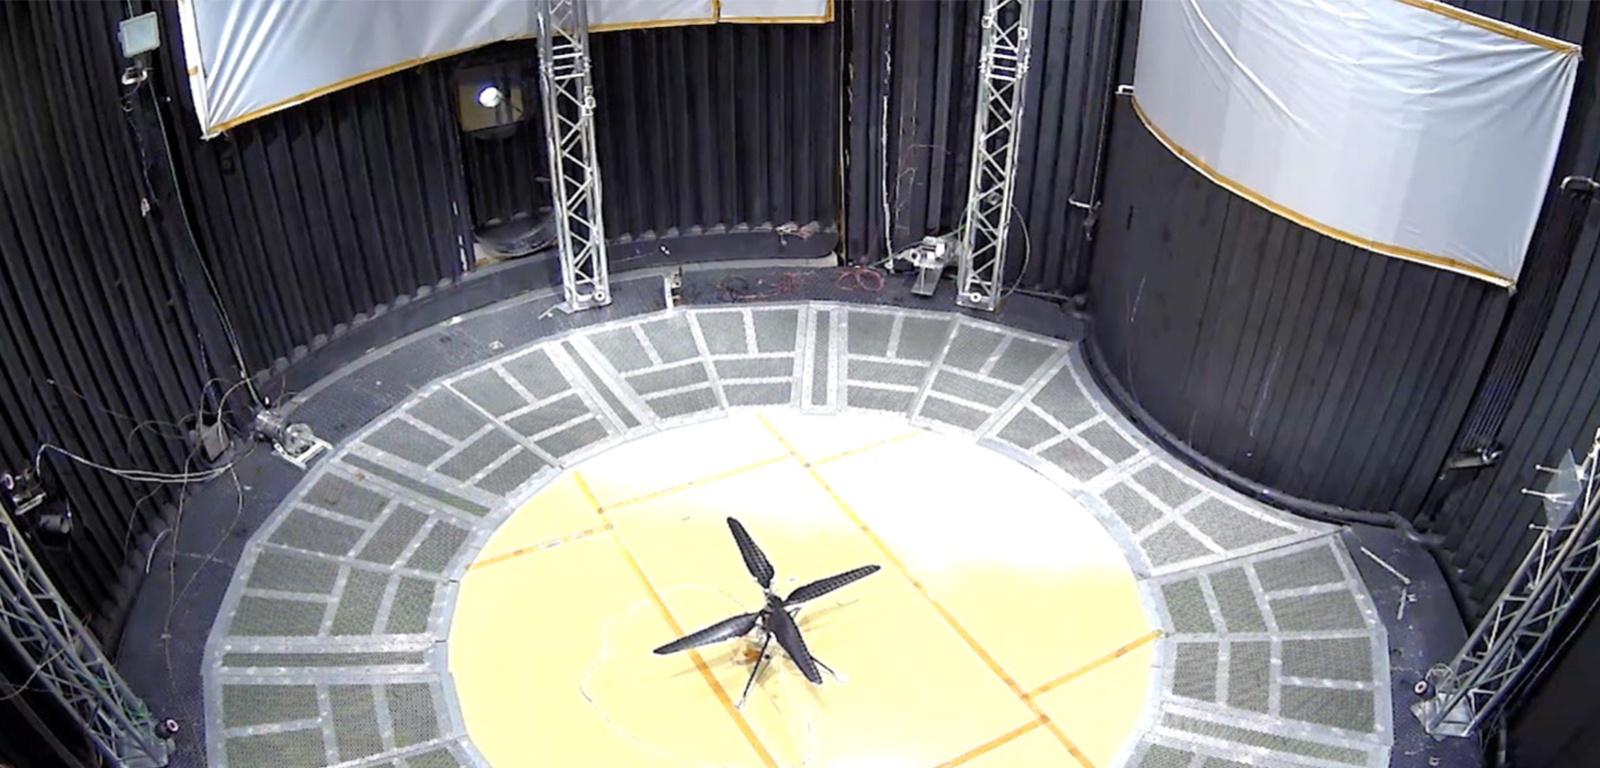
First Controlled Flight of Mars Helicopter Prototype
This image shows a test flight of a full-scale prototype of the Ingenuity Mars Helicopter.
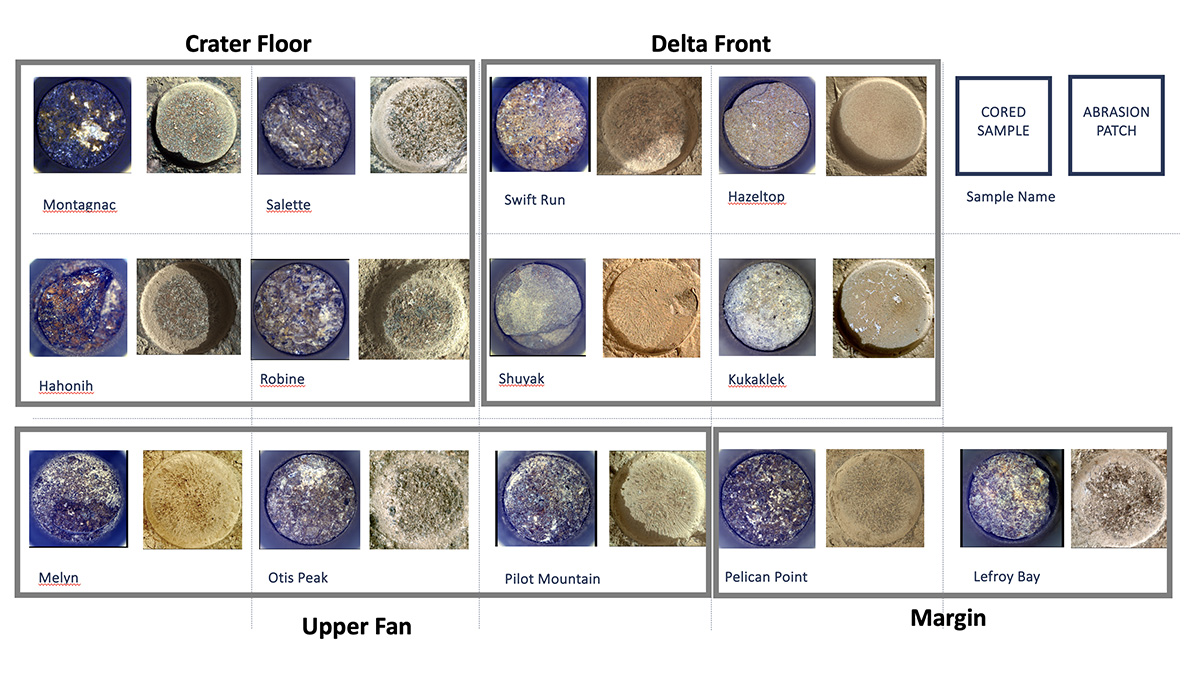
Cored Samples Aboard Perseverance at Sol 1,000
Shown here is an annotated representation of the 13 sample tubes containing rock-core samples that are being carried aboard NASA’s…
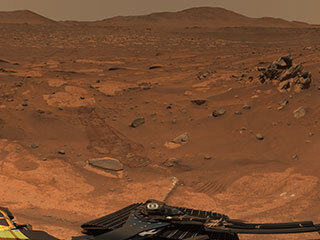
Perseverance’s 360-Degree View From ‘Airey Hill’
This 360-degree mosaic from the “Airey Hill” location inside Jezero Crater was generated using 993 individual images taken by the…
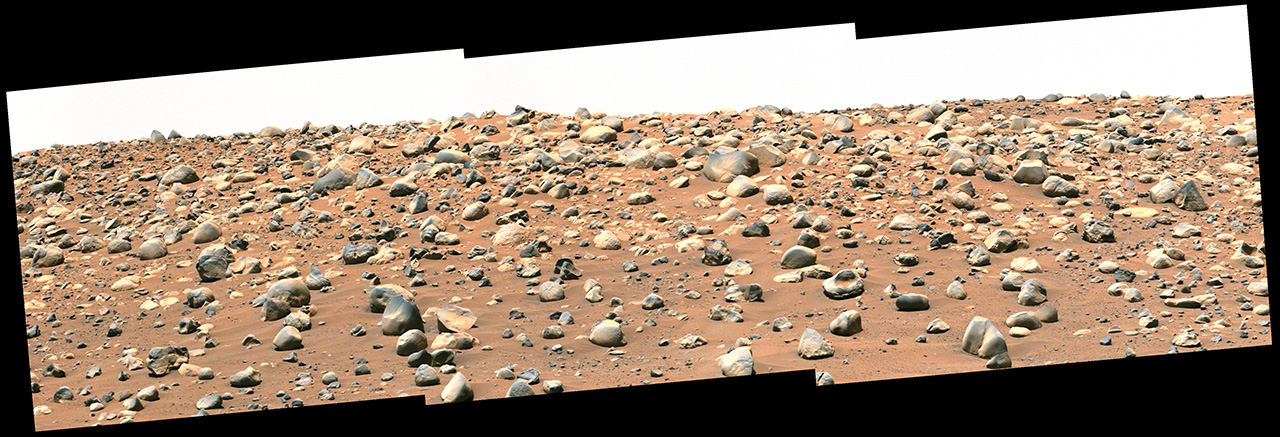
Perseverance’s Mastcam-Z Views ‘Castell Henllys’
NASA’s Perseverance Mars rover captured this mosaic of a location nicknamed “Castell Henllys” using its Mastcam-Z camera on April 13,…
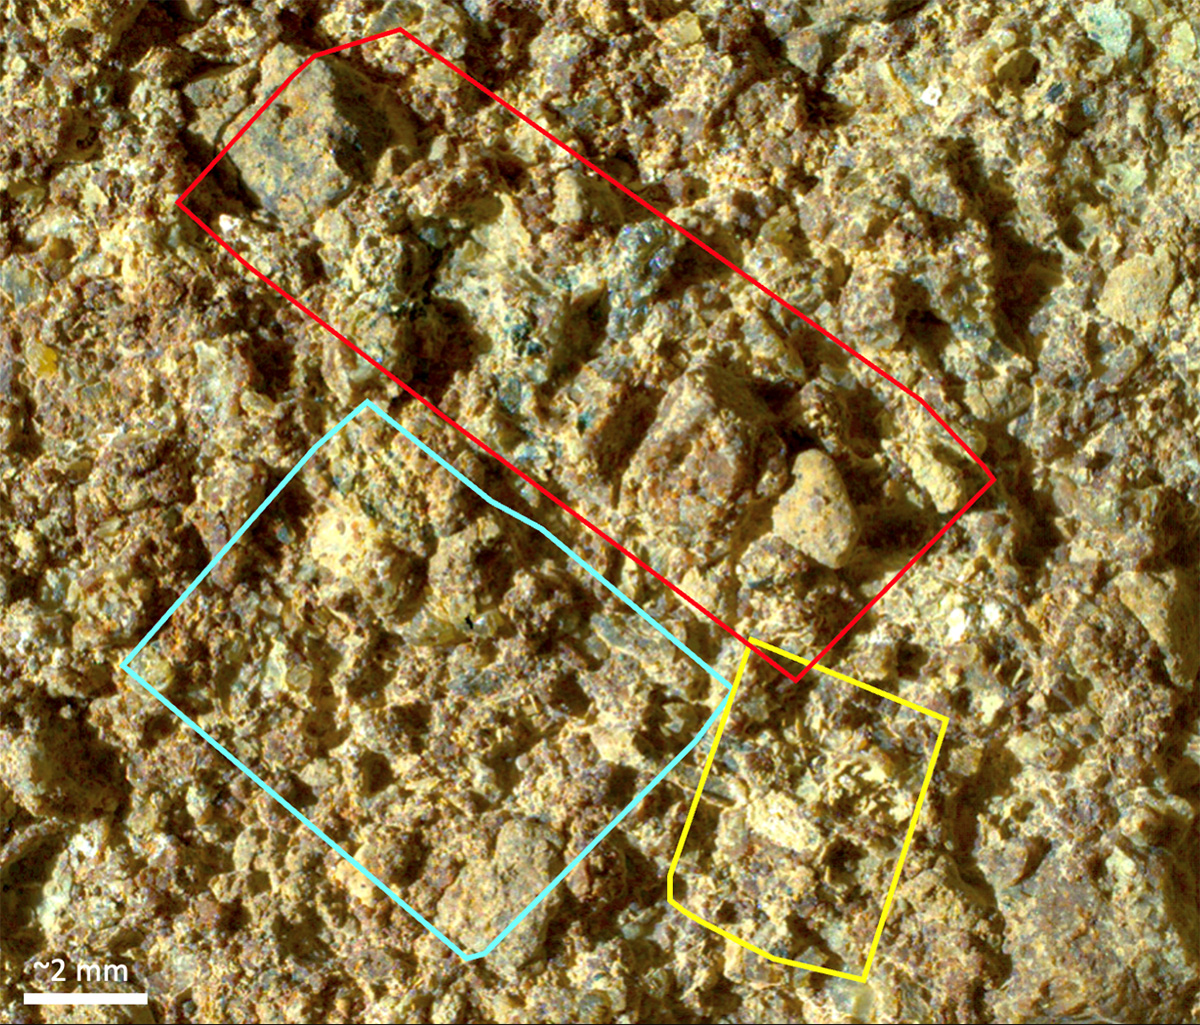
PIXL Instrument on NASA’s Perseverance Studies ‘Ouzel Falls’
PIXL, one of the instruments aboard NASA’s Perseverance Mars rover, analyzed the chemical makeup of an area of abraded rock…
